Education
- 606 Early Years settings
(91.4% good or outstanding) (June 2024) - 244 primary schools
- 41 secondary schools
- 20 special schools
(including eight independent special schools) - Three alternative provision schools
- Four further education colleges (including South Gloucestershire and Stroud College)
- Up take of free two-year-old early education and childcare for eligible families in 2023 70.1%
 Key:
Key:
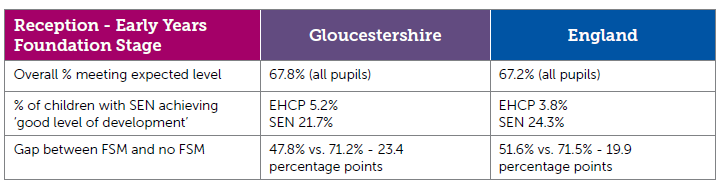
- SEN - Special Educational Needs
- FSM - Free School Meals
- EHCP - Education, Health and Care Plan
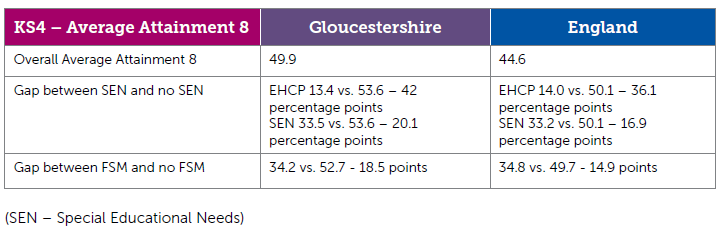
Looking at educational outcomes by ethnic groups does not show a consistent pattern, and changes through the stages due to a complex mix of cultural differences, international migration patterns, and children travelling into the county from neighbouring areas for secondary school, amongst others. Asian pupils perform best at Key Stage 2 and Key Stage 4 in Gloucestershire and in 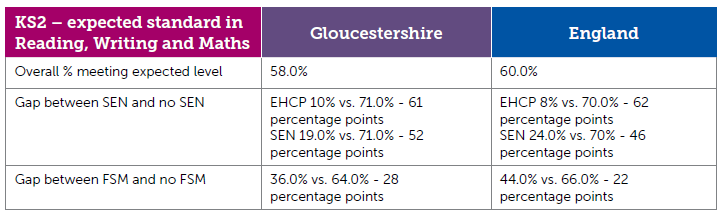 England as a whole. In Key Stage 2 the proportion of Black and Other Ethnicity in Gloucestershire achieving the expected level is below the average for the county and below our statistical neighbours and England. In Key Stage 4 all ethnic group categories perform better than their statistical neighbour and England counterparts.
Before the pandemic, around 10% of pupils across all schools were persistently absent (missing 10% or more sessions), in 2022/23 Gloucestershire reported 20% persistent absence, this pattern is similar to that seen nationally. Rates of Electively Home Educated (EHE) children have been rising in Gloucestershire as seen nationally. In Gloucestershire they have risen from 13 per 1,000 CYP aged 5-15 in 2017/18 to 25.6 per 1,000 in 2022/23. The rate of EHE in Gloucestershire in 2021/22 was significantly higher than the statistical neighbour, regional and England average.
 Families do not always provide a reason for choosing Elective Home Education; however, where they have provided a reason the most common were Philosophical / Lifestyle / Preferential (19%), Mental Health (19%) and Dissatisfaction with School (combined bullying, SEND, and general dissatisfaction with school - 10%). These proportions are similar to those in our statistical neighbours and the South West region.
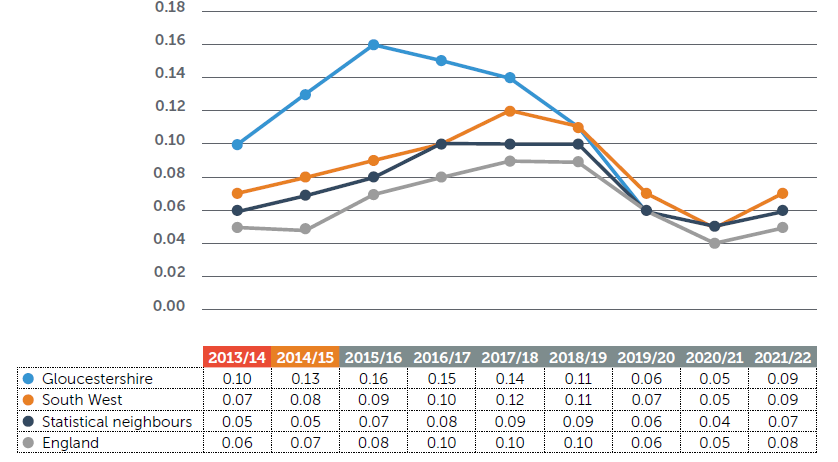
Permanent exclusions across all school phases were historically high in Gloucestershire but
started to decline in 2015/16 and fell into line with national proportions. A sharp increase was
then observed nationally following the pandemic. Exclusion rates in primary age pupils, though
low (0.05 in 2021/22) are currently above England (0.02) and Statistical Neighbour averages (0.01)
and require monitoring.
Total permanent exclusions - % of school population
School suspensions in Gloucestershire have followed a similar trend to England and our
Statistical Neighbours, with the most recent data putting us below the national and neighbour rate (6% compared to 7% in 2021/22). Proportion of young people aged 16 to 24 not in education, employment of training (NEET) is lower for Gloucestershire than the England average
(2.4% vs. 2.8% in 2023).
Last reviewed: